
Compare an industrial liquid filter by collecting representative upstream and downstream samples under matched operating conditions, then analyzing both with a method suited to the contaminant. A downstream sample alone can describe the liquid delivered at that moment, but it cannot establish how much the filter removed. Record flow, temperature, differential pressure, sample timing, and the condition of the element so that a laboratory result remains connected to the production process.
What Decision Should the Sampling Plan Support?
Define the decision before choosing the bottles or instruments. A trial intended to protect spray nozzles needs evidence about troublesome particles, while a polishing step evaluated for visual clarity may need a different measurement. The sampling plan should translate the actual downstream requirement into an observable acceptance criterion.
Distinguish an investigation from a release test. An investigation explores causes and may use several methods; a release test needs an agreed method, limit, and disposition rule before the samples arrive. Changing the criterion after seeing results makes the comparison difficult to defend.
For a project involving industrial liquid filtration equipment, specify the process stream and the quality problem in the inquiry. Avoid requesting a filter that merely makes a sample look clear. Appearance can conceal fine particles, and dissolved contaminants require a different treatment mechanism.
Where Should the Two Samples Come From?
Place the sampling locations close enough to the filter to isolate its contribution, while using properly designed, accessible sample connections. A downstream tank may introduce mixing, settling, contamination, or another filtration stage. Sampling there can evaluate the overall process, but it no longer measures only the element under review.
Draw a simple boundary around the equipment and identify every connection that crosses it. Include recirculation lines, bypasses, flushing connections, and shared return headers. A line that looks inactive on a drawing may still affect the sample when a valve position changes.
Ask the site team to establish a safe collection procedure for the actual liquid, pressure, and temperature. Do not loosen a housing connection to improvise a sample point. The required flushing volume depends on the connection and dead volume, so a universal number is inappropriate.
How Should Sampling Times Be Matched?
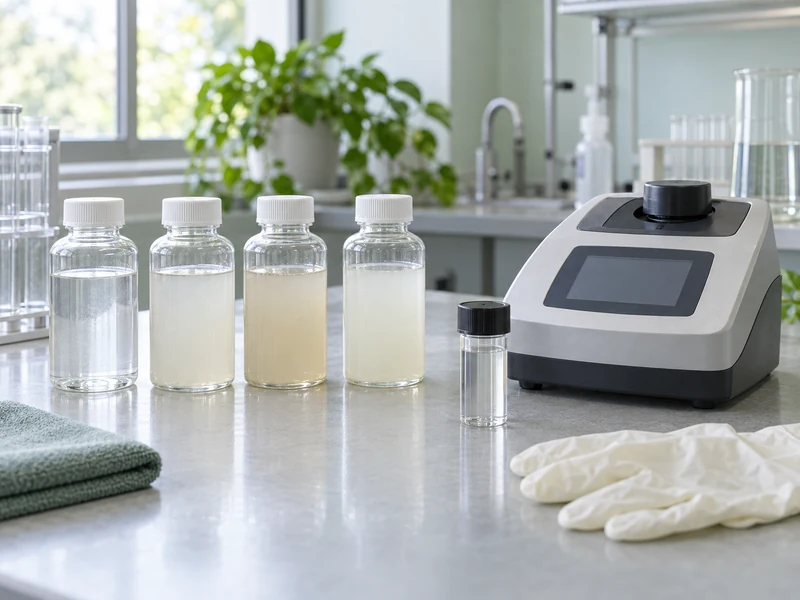
Match samples to the same operating interval rather than simply collecting two bottles at an arbitrary clock time. Liquid needs time to travel between the sample points. In a rapidly changing batch, that delay can make simultaneous samples represent different feed conditions.
Estimate the intervening liquid volume and compare it with the measured flow to obtain a starting estimate of transport time. Treat this as a practical approximation, because mixing vessels and complex pipework broaden the residence-time distribution. When that uncertainty matters, use a process-approved method to characterize it before claiming paired performance.
Separate startup, stable production, and late-cycle samples in the records. Combining these stages into one average can hide a brief breakthrough or an extended startup recycle period. A useful report explains both the steady result and the time required to reach it.
For batch processes, the site’s discussion of batch and continuous filtration provides broader operating context. Here, the key issue is whether the two bottles actually represent comparable feed and filtrate.
Which Measurement Answers the Question?
Choose particle counting, retained-solids mass, turbidity, microscopy, or another validated method according to the required decision. Each analytical technique responds to a particular feature of the liquid, so choose the result that corresponds to the production requirement instead of treating the available measurements as equivalent indicators. A lower turbidity reading does not prove a particular micron retention efficiency.
The EPA turbidity method describes a light-scattering measurement and identifies interferences such as bubbles and settling material. Its scope and laboratory requirements must be checked against the sample matrix. It is a useful reference for suitable aqueous samples, not a universal test for every industrial solvent or concentrated slurry.
If particle counts are used, specify the size channels, sample preparation, reporting units, and instrument limitations. If gravimetric solids are used, specify the analytical filter, drying procedure, and balance requirements. Changing these details between upstream and downstream samples can manufacture a difference unrelated to the production filter.
| Decision | Potential Evidence | Main Limitation to Address |
| Protect an opening from particles | Counts or microscopy at relevant sizes | Particle shape and instrument sizing assumptions |
| Reduce suspended solids loading | Mass concentration using an agreed method | Sampling and analytical detection limits |
| Improve aqueous clarity | Turbidity under controlled conditions | Bubbles, color, and settling interference |
| Approve a finished product | Product-specific quality assay | Method suitability and release criteria |
What Controls Make the Results More Credible?
Use clean, compatible containers and an identification system that links each sample to its operating record. Include field or handling blanks when contamination during collection is a credible concern. Duplicate samples can help reveal variation, although agreement between duplicates does not prove that the sampling location was representative.
Record the collection time, analysis time, storage conditions, and any mixing or dilution. Settling, agglomeration, precipitation, or adsorption to the container can change what the laboratory sees. The handling procedure should preserve the property being measured rather than merely make transport convenient.
Give the laboratory enough information to identify likely interference without asking it to infer the expected answer. A coded comparison can reduce interpretation bias where practical. Keep retained samples only when their stability and storage conditions make later analysis meaningful.
How Can Removal Be Calculated Without Overclaiming?
For comparable concentration measurements, apparent removal can be expressed as one minus downstream concentration divided by upstream concentration, multiplied by 100. Both measurements must use the same basis and represent the same process condition. The calculation is not meaningful when the upstream concentration is effectively zero or poorly resolved by the method.
Consider an illustrative trial with 80 units upstream and 8 units downstream on an agreed concentration basis. The calculated reduction is 90%, but that result applies only to the measurement, sample pair, and operating condition used. It does not establish an absolute micron rating or lifetime performance.
If the downstream result is below the reporting limit, report that limit instead of treating the concentration as zero. State an appropriate bounded result with laboratory guidance. A table full of assumed zeroes can make a weak test look far more conclusive than it is.
Keep the supplier’s nominal or absolute micron designation alongside its stated test basis, because that classification provides context for interpreting the sample results without replacing the process-specific evidence. A field sampling result and a supplier’s standardized efficiency claim answer related but different questions.
What Should Happen When the Samples Disagree?
Investigate the sampling chain before concluding that the media failed. Check bottle identification, port flushing, flow changes, bypass positions, instrument checks, and analysis timing. An unexpected result deserves a controlled repeat with the same method, not immediate replacement with a finer element.
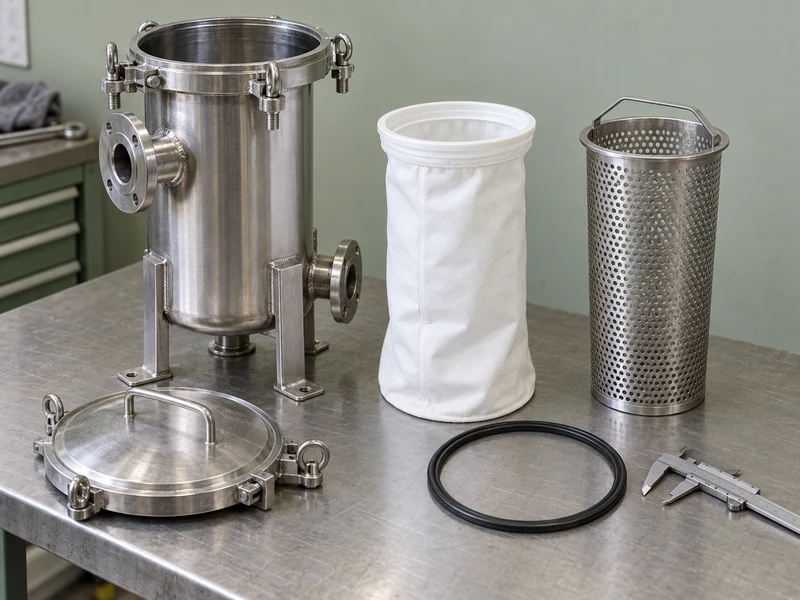
If repeated results confirm poor separation, inspect both the filtration material and the installed flow path. A sealing problem can send liquid around otherwise suitable media. Changing the micron grade will not repair that route.
When considering high-efficiency liquid filter bags, ask for the relevant efficiency evidence and verify that the proposed bag fits the actual housing. The site’s micron selection guide can support the subsequent grade decision after the measurement itself has been validated.
How Should Results Be Presented to Production Staff?
Present each sample pair beside the process state it represents, using consistent units and a clear pass, fail, or inconclusive decision. Include the upstream result even when the downstream value is the primary release measure. This helps operators see whether an apparently improved filtrate coincided with a cleaner feed.
Use a separate note for deviations such as a delayed analysis or an interrupted sampling sequence. Do not bury those conditions inside a footnote that disappears when the table is copied into another report. A practical worksheet should retain sample identity, equipment identity, and the decision basis together.
Before routine adoption, ask another trained person to follow the written method and compare the resulting records. Differences in interpretation often expose missing details more effectively than another review by the original author. Resolve those differences before treating the method as a repeatable production check.
What Belongs in the Final Trial Record?
Produce a record that another engineer could use to understand the test without relying on memory. Attach the sampling sketch, element identification, operating data, laboratory method, raw results, and any deviations. Separate measured observations from the team’s explanation of their cause.
Conclude with a decision tied to a defined operating window. Approval may cover one liquid and temperature range while leaving another recipe unqualified. That limitation is useful information for production planning rather than an inconvenience to remove from the report.
A practical handover should identify the person responsible for future sampling, the events that trigger another check, and the location of the approved method. Supplier changes, process changes, or unexplained downstream defects may justify renewed testing. With those controls in place, sampling becomes a repeatable decision tool instead of a collection of isolated laboratory numbers.