
High pressure drop in a liquid filter usually comes from accumulated solids, a liquid that has become harder to pump, excessive flow through the available filter area, or a restriction in the housing and connected pipework. A newly installed element can also create a high reading if its construction differs from the previous one. Before replacing another bag or cartridge, establish where the pressure is being lost and compare the readings at the same flow and temperature.
An elevated inlet reading, taken on its own, gives an operator too little information to diagnose the filter. The diagnosis depends on changes in the pressure difference, any accompanying process changes, and the quality of the filtered liquid. Those three observations separate a normal end of service life from a sizing, installation, or process problem.
Start with the pressure difference, not one gauge
Differential pressure is the upstream pressure minus the downstream pressure. Both readings must use compatible units and refer to the same operating condition. If the inlet pressure rises while the outlet rises by the same amount, the filter differential has not increased. A change farther downstream may have raised the pressure throughout that part of the line.
Take the readings together. A reading before a pump speed adjustment and another after it do not describe the same event. On a fluctuating process, use a suitable differential instrument or synchronized measurements. Record the flow rate and liquid temperature beside the pressures; otherwise, a comparison with yesterday’s shift can be misleading.
Also identify what lies between the pressure connections. If the upstream gauge is before a valve and the downstream gauge is several bends beyond the housing, the reading includes those losses. That measurement may be useful for the whole installation, but it cannot be assigned entirely to the filter element. Mark the measurement locations on a simple line sketch before troubleshooting.
Check whether the instruments can be trusted
A plugged pressure connection, damaged gauge, or unsuitable instrument range can turn a routine investigation into unnecessary filter replacement. Check calibration status and whether the fluid can solidify or collect in the connection. Compare instruments using the plant’s approved procedure. Do not loosen a live fitting to see whether liquid comes out.
Small differences deserve particular care when calculated by subtracting two much larger gauge readings. The uncertainty of each instrument contributes to the uncertainty of the result. If the apparent change is similar to that uncertainty, improve the measurement before changing the process.
Separate clean resistance from dirt loading
A filter has resistance before it captures any contamination. The clean pressure drop reflects the element, housing, liquid, and flow together. As retained solids accumulate, additional resistance develops. Distinguishing these two components is often the fastest route to the cause.
Establish a clean baseline after correct installation, filling, venting, and stabilization. Use the approved production liquid when practical. A clean water test does not automatically represent a concentrated resin, oil, or cold process stream. Keep the baseline with the element identification and operating conditions rather than recording a pressure value on its own.
If every fresh element starts high, investigate flow, viscosity, media selection, and the flow path. If the initial reading is normal but climbs faster than usual, investigate the contamination load and the way it interacts with the medium. If a new element does not restore the old baseline, the restriction may remain elsewhere in the system.
A useful operating record follows differential pressure against processed volume as well as time. An eight-hour run at half the normal throughput cannot be compared fairly with an eight-hour run at full output. For variable batches, note the product grade and feed source too. A trend that looks erratic by clock time may become consistent when expressed against the amount of liquid treated.
Check flow and temperature together
More flow through the same effective area generally means greater resistance. A production increase can therefore produce a high clean differential even when the replacement element is correct. Check actual flow instead of relying only on the pump setting. Changes in valves, downstream demand, or the pump control strategy can alter the duty without changing the filter specification.
For many liquids, lower temperature increases viscosity. The effect can be pronounced at the beginning of a shift or after an outdoor storage tank cools overnight. Compare the cold start with the stable production period. If resistance falls as the liquid warms while flow remains comparable, viscosity is a strong candidate.
Do not assume all formulations behave like water. Some change viscosity with shear, concentration, or temperature in ways that make a simple correction unreliable. Ask for pressure-flow information appropriate to the liquid, and use a controlled trial when the fluid behavior is uncertain. Heating is only an option if the product, process, seals, and equipment permit it.
Use normalization cautiously
Under limited conditions, resistance through a clean porous medium can be approximated as proportional to viscosity and flow. That relationship can help interpret a trend, but it does not describe every part of an installation. Housing and fitting losses, a compressible deposit, and non-Newtonian fluids can behave differently.
For an illustrative check, suppose the same clean element is tested at unchanged temperature and liquid composition, but the production flow has increased. A higher differential is expected; that alone does not demonstrate a defective element. The next step is to compare the result with the relevant performance curve or a validated test, not to impose a universal pressure allowance.
Look at what the filter is collecting
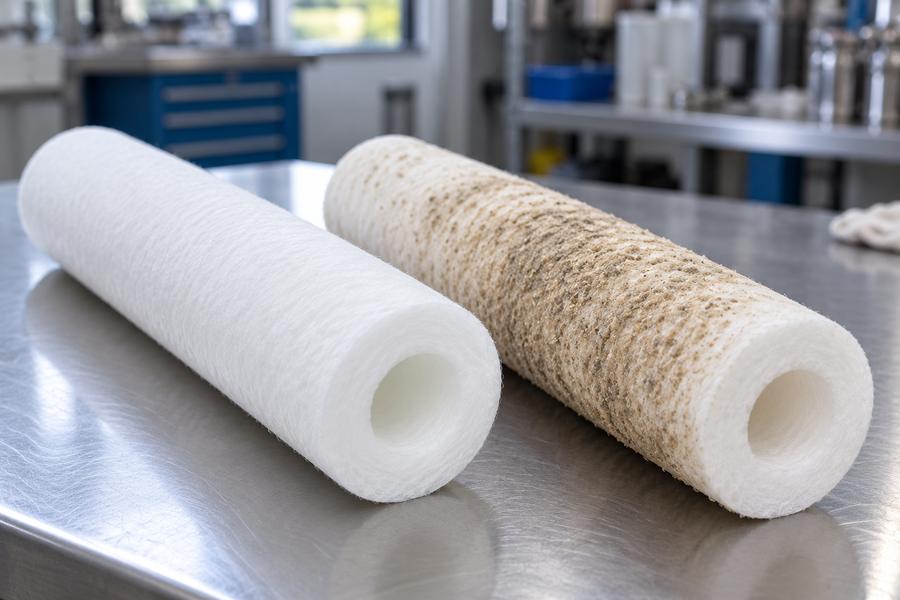
A rapid increase from a normal baseline often reflects a change upstream. Tank sediment can be disturbed during transfer. A new raw material lot may contain more fines. Cleaning residue, corrosion debris, or material released after maintenance can reach the filter in a short burst. Compare the timing of the pressure increase with the production and maintenance log.
Contaminant character matters as much as its mass. Hard particles, soft gels, fibers, and sticky agglomerates do not form the same deposit. A relatively small quantity of deformable material can obstruct flow differently from a larger quantity of coarse particles. If the liquid has changed formulation, keeping the same micron label does not guarantee the same service life.
Retain representative upstream samples and inspect the spent element after safe removal. Record where the material accumulated and whether the appearance differs from earlier runs. Keep photographs of used elements alongside the batch records to document changes in the deposit; identifying its chemical composition requires more than a visual comparison. Use appropriate laboratory analysis when the cause affects product quality or repeats without explanation.
A staged arrangement may help when a distinct coarse fraction is consuming the final element’s capacity. It will not necessarily solve a stream dominated by fine gel that blinds both stages. Before adding equipment, establish which material each stage would remove and how its addition would affect the total pressure available to the process.
Review the element specification beyond its micron label
Two elements carrying the same nominal micron value may have different removal efficiencies, media thicknesses, structures, and clean resistances. A change from a relatively open medium to a more efficient construction can raise the starting differential while improving particle retention. That can be an intended tradeoff, provided the system was sized for it.
Compare the full part specification with the previously approved element. Include material, dimensions, end connection or bag collar, support requirements, and the stated test conditions. Where a supplier provides an efficiency curve, compare performance at the particle size that matters to the product rather than treating a printed rating as a complete description.
For a bag system, the choice of liquid filter bag material and construction should follow the liquid chemistry and contaminant profile. A medium that works well in one water service may be unsuitable for another formulation. Chemical compatibility also includes the effect of cleaning agents and the temperatures reached during cleaning.
For cartridges, verify that a replacement fits the intended seal and support arrangement. Length alone is not enough. An element can appear to fit while its end connection, gasket compression, or internal support differs from the approved design. Keep the packaging identification until installation and performance checks are complete.
Inspect the housing and connected flow path
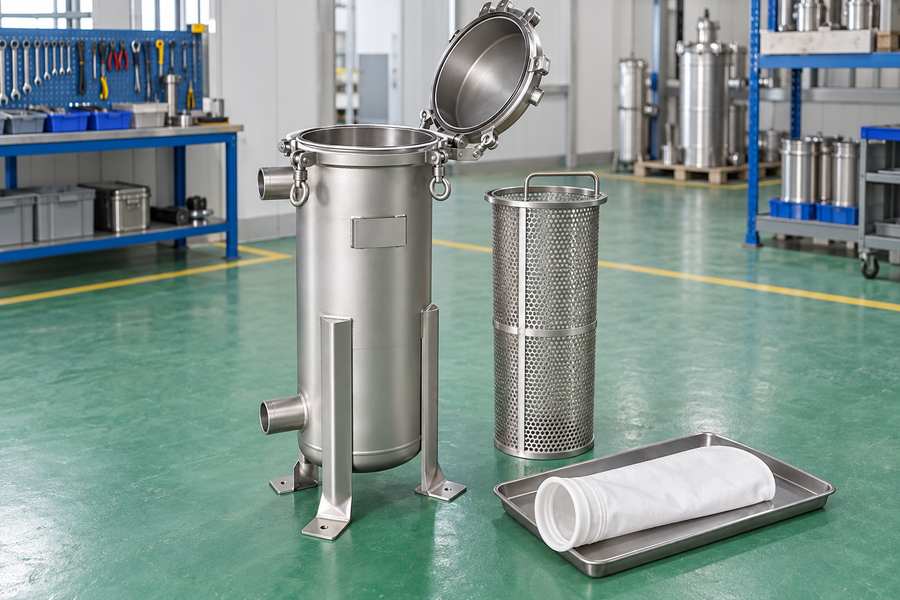
A blocked support basket, incorrectly positioned element, partly closed valve, or obstructed outlet can remain in place after a filter change. Inspect these items during a planned, isolated shutdown. The equipment must be depressurized and handled according to its operating procedure before opening.
In a bag housing, confirm that the bag is seated correctly and supported as intended. A folded or poorly positioned bag can reduce the area available for flow. The basket should be clean and undamaged, and the retaining arrangement should match the housing design. Do not remove the basket to create a lower pressure reading; it has a mechanical function.
Check flow direction against the actual equipment documentation. Do not assume that every cartridge design uses the same direction, or that the visible location of a nozzle proves its function. During a retrofit, a line drawing and the installed arrangement can diverge. Verify both.
Review the complete stainless steel filter housing configuration, including its connections and internal arrangement. A large vessel connected through restrictive pipework may still limit the process. Increasing media area cannot remove a loss that is mainly occurring through an undersized valve or connection.
Use the shape of the trend to choose the next check
| Observed behavior | Likely direction for investigation | Useful comparison |
| High differential immediately after replacement | Flow, viscosity, element construction, installation, or a remaining restriction | Approved clean baseline at matching conditions |
| Normal start followed by unusually fast loading | More contamination or a different contaminant type | Upstream samples and processed volume |
| Pressure changes with temperature | Viscosity or temperature-dependent deposits | Flow and liquid condition at each reading |
| High inlet and outlet pressures with little change in their difference | System backpressure outside the measured filter loss | Downstream equipment and valve positions |
| Unexpectedly low differential with poorer filtrate quality | Bypass, damaged media, or a measurement problem | Seal inspection and paired quality samples |
These patterns guide the investigation; none proves a cause by itself. Several changes can occur together. A cold batch with an unusually high solids load may show both high starting resistance and a steep subsequent rise. Read each pressure trend alongside the conditions logged for that batch, allowing for more than one contributing cause.
Run a controlled correction, then confirm the result
Change one meaningful variable at a time when production conditions allow it. If the suspected cause is excessive flow, test an approved lower rate and record both differential pressure and downstream quality. If the suspected cause is media selection, compare suitable candidates under matched conditions. Keep the stopping criteria within the limits of the housing, element, seals, and process.
Never use the housing design pressure as the element changeout limit. Internal pressure and differential pressure describe different loads. The allowable operating condition also depends on temperature and the weakest applicable component. Use the documented limits for the specific assembly and the plant’s approved operating procedure.
A successful correction must protect throughput and filtrate quality together. A coarser element can lower resistance simply by allowing more contamination through. Record the quality result during startup and near the end of the run, not just immediately after fitting a fresh element. An apparently longer service life is not an improvement if the product no longer meets its requirement.
After the trial, update the clean baseline, inspection notes, and replacement criteria. Include the part number, batch or lot identification where available, actual flow, liquid temperature, processed volume, and reason for stopping. That short record gives the next shift a usable reference and makes repeated faults easier to recognize.
High pressure drop becomes much easier to resolve when the investigation follows the evidence: verify the measurement, distinguish clean resistance from loading, match the conditions, and inspect the real flow path. The right correction may be a different element, more area, an upstream process change, or a repaired restriction. The pressure reading tells you where to begin; the complete operating record tells you which change is justified.