
Measure baghouse energy by defining the equipment boundary, recording actual electrical consumption, and dividing it by a meaningful production quantity over matched periods. Keep airflow capture and emission performance as acceptance conditions throughout the comparison. A lower electricity total is not an improvement if it results from reduced production or inadequate dust collection.
Which Equipment Belongs Inside the Energy Boundary?
Identify every energy user included in the claim. The exhaust fan is often the most visible, but cleaning air, discharge equipment, and auxiliary devices may also contribute. State whether the study covers the fan alone or the complete collection system.
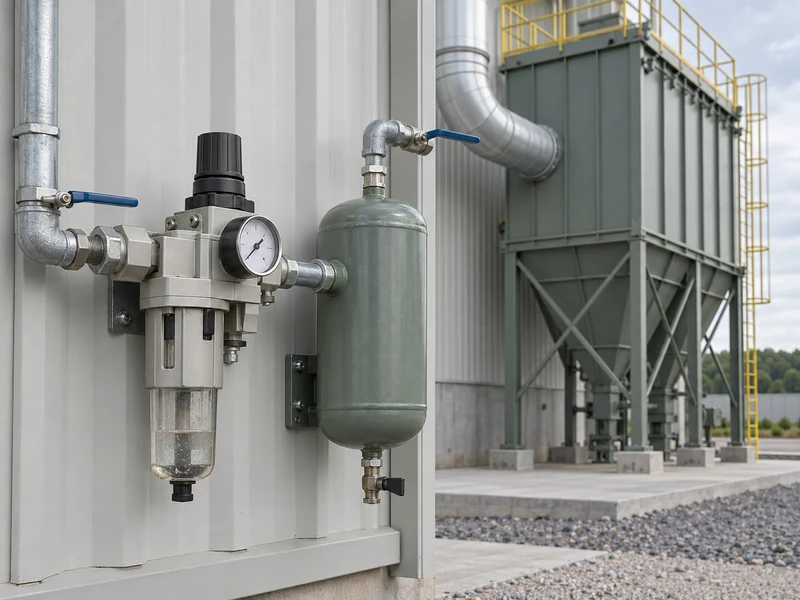
Compressed air is especially easy to omit because the compressor may serve the whole plant. Where direct allocation is unavailable, report the limitation or use a justified estimate with its assumptions. Do not present an allocated estimate as a dedicated electrical meter reading.
For a pulse-jet dust collection system, draw the boundary before selecting meters. The diagram should show the fan, cleaning-air connection, discharge equipment, and relevant controls. This prevents a later comparison from quietly excluding an energy user that increased.
What Production Denominator Is Appropriate?
Choose a production quantity that reflects the service the collector provides. Tonnes of processed material, operating batches, or hours of a defined process state may be useful depending on the application. The denominator should remain consistent across the comparison.
A mixed-product plant may need separate baselines for different recipes or lines. One tonne of a low-dust product may not impose the same extraction duty as one tonne of another material. Combining them without adjustment can obscure both energy and performance changes.
Record idle, startup, cleaning, and production periods separately where possible. A plant with long idle running may show high energy per tonne even when the fan operates efficiently during production. That finding points toward operating schedules rather than automatically toward new filter media.
Which Measurements Should Be Collected Together?
Record electrical energy, production quantity, operating hours, fan state, and relevant process conditions over the same interval. Include airflow or another approved capture-performance indicator and the available emission or filtration checks. The exact measurements should match the plant’s established performance requirements.
Also record filter differential pressure and cleaning activity as explanatory variables. They help interpret the energy trend but do not replace electrical measurement. A change in differential pressure alone does not establish the magnitude of energy savings.
The Department of Energy fan-system sourcebook advocates evaluating the complete system and its operating needs. That systems perspective is useful for the baseline. It should not be read as a promise that a specific filter change will produce a fixed percentage reduction.
How Should the Basic Indicator Be Calculated?
For a defined interval, divide measured energy by the corresponding production quantity. If a hypothetical collector consumes 1,200 kWh while the associated process produces 300 tonnes, the indicator is 4 kWh per tonne. This is an illustrative calculation, not a Zonel performance figure.
Keep the original energy and production values beside the ratio. A ratio alone can conceal a large change in operating hours or throughput. Review the underlying records before interpreting a difference as improved efficiency.
If the next interval shows 900 kWh and 150 tonnes, the ratio rises to 6 kWh per tonne even though total energy fell. The lower production quantity explains why the two statements are compatible. This is why energy totals and normalized indicators should be reported together.
| Indicator | What It Reveals | What It Does Not Prove |
| Total kWh | Energy used during the interval | Equivalent production or capture duty |
| kWh per tonne | Energy relative to output | Equivalent product mix |
| Idle operating hours | Time without associated production | Whether shutdown was operationally permissible |
| Filter differential pressure | Resistance trend at the measured condition | Electrical savings by itself |
How Can Comparable Operating Periods Be Selected?
Choose periods with similar process duties and explain any remaining differences. Product mix, extraction points in use, ambient conditions, and maintenance state may affect the result. A short unusually clean run should not be compared with a long baseline containing several process upsets.
Where sufficient data exist, group records by operating state before comparing averages. A more advanced model may account for production rate and other influential variables, but its assumptions should remain visible. Complexity does not compensate for missing or unreliable measurements.
The site’s required airflow calculation guide addresses the extraction duty itself. An energy study uses the approved duty as a constraint. It should not redefine adequate capture simply to obtain a lower consumption figure.
What Can Fan Control Data Explain?
Fan speed, damper position, and operating state can help explain why energy changes. Their interpretation depends on the actual fan and system. Do not infer electrical input directly from speed without considering the operating point and equipment characteristics.
If a control change is proposed, evaluate it through the authorized engineering process and verify collection performance afterward. A lower speed may reduce power but also reduce capture at a critical point. The acceptance decision must include both outcomes.
Record whether the fan control automatically compensates for changing filter resistance. Two installations with similar bags may show different energy responses because their control strategies differ. That difference limits the usefulness of an unsupported percentage-savings comparison between sites.
How Should Cleaning-Air Consumption Be Included?
Measure cleaning-air use where practical or establish a transparent allocation method. Record cleaning frequency and the relevant supply conditions at the same time. A higher pulse count does not translate directly into energy without information about the air demand and supply system.
Distinguish leakage from productive cleaning demand. A fault that consumes air continuously can be hidden in a plant-wide compressor total. Correcting it may improve the energy baseline without changing the filter media.
The site’s article on reducing baghouse resistance covers operational causes of resistance. The energy study should measure the consequence of any approved correction rather than assume that resistance and energy move in a fixed proportion.
How Can a Filter Trial Be Evaluated Fairly?
When testing another dust filter bag construction, compare equivalent production and accepted collection performance. Include the initial conditioning period and the later operating state. A new bag and a mature bag may not have directly comparable resistance histories.
Agree on the trial duration and the events that would invalidate a comparison. Feed changes, leaking access doors, instrument faults, or altered extraction points may require a separate analysis. Keep those events in the record rather than deleting unfavorable periods without explanation.
The site’s dust filter media selection article supplies context for material suitability. Energy evidence should be one part of the decision alongside emissions, service life, cleaning behavior, and process compatibility.

What Should Be Reported as Measured or Estimated?
Label direct meter readings, calculated quantities, and engineering estimates separately. Include meter identity, interval, data gaps, and any allocation assumptions. Retain the interval energy total and its corresponding production quantity in the worksheet so that a second engineer can repeat the division and trace the reported ratio back to its inputs.
If production measurement is uncertain, explain how that uncertainty affects the ratio. Small apparent improvements may be indistinguishable from measurement variation. Avoid reporting excessive decimal places that suggest more precision than the data support.
Keep the energy tariff calculation separate from the physical energy result. Tariff structure and demand charges can change the financial outcome without changing kWh. Use the site’s actual commercial data when a cost estimate is needed.
How Should Missing Data Be Treated?
Flag missing intervals and state whether they were excluded, estimated, or covered by another reliable measurement. Do not fill a gap with a favorable operating period simply to complete a monthly chart. The treatment of missing data should be consistent before and after an improvement.
If an outage removes a substantial part of the comparison period, extend the study or narrow the conclusion. A shorter defensible result is preferable to an annualized claim based on an unrepresentative fragment. Keep the limitation attached to any reported savings figure.
What Makes the Baseline Useful After the Study?
Assign an owner to review the indicator and the conditions under which it is valid. Set a practical response to unexpected changes, such as checking production mix, meter health, operating schedules, or filter condition. A baseline is useful only if the team knows what action follows a deviation.
Update the baseline when the process or equipment changes materially, while retaining the earlier record. This preserves the ability to distinguish a new duty from deteriorating performance. The result is a traceable operating history rather than a one-time savings claim.
Share the boundary diagram, matched operating records, and accepted performance requirements when discussing improvements with Zonel Filtech. That evidence allows the conversation to focus on the plant’s actual energy drivers. It also protects the central requirement that dust collection continue to perform its intended job.