
Membrane filter press payback depends on whether its additional installed cost is recovered through net annual savings against a chamber press. Base each option on identical yearly solids recovery.
Use representative trials to measure cake dryness, complete-cycle throughput, and filtrate quality. Include disposal, energy, consumables, maintenance, membrane replacement, and realistic utilization, while avoiding double-counted capacity benefits.
How Do Membrane and Chamber Presses Compare in Operation?
Compare Dewatering Methods, Not Equipment Labels
A chamber press fills recessed cavities with slurry. Liquid drains through cloth as solids form cakes; feed pressure drives filtration until the chosen endpoint.
A membrane press adds a squeeze stage after initial cake formation. Membranes compress the cake, potentially displacing further liquid before plates open for discharge.
Improved dryness is possible, but slurry compressibility, conditioning, feed variability, and squeeze duration determine the result. Extra squeezing can also lengthen a complete cycle.
Measure the Same Processing Duty
Compare the same annual captured dry solids, rather than equal wet cake tonnage. Verify solids capture and filtrate quality so apparently favorable dryness does not conceal solids losses.
Count filling, filtration, squeezing where fitted, cake discharge, plate movement, and recurring cleaning. A faster filtration stage alone does not prove greater hourly output.
Dry solids throughput (t/h) = Captured dry solids per cycle (t) / Complete cycle time (h).
Use representative feed samples, documented conditioning, and repeated cycles to capture operating variation. Record each performance measure before translating trial differences into money.
If feed solids fluctuate by production batch, document the range tested. A single favorable run may overstate repeatability of cake dryness or cycle performance.
| Trial measurement | Chamber press | Membrane press |
| Captured dry solids per cycle | Measured t | Measured t |
| Complete cycle time | Measured hours | Measured hours |
| Cake dry solids content | Laboratory % | Laboratory % |
| Dry solids throughput | Calculated t/h | Calculated t/h |
| Filtrate quality | Tested against requirement | Tested against requirement |
| Energy per dry tonne | Measured kWh/t | Measured kWh/t |
What Additional Installed Cost Must Be Recovered?
Establish Equivalent Equipment Boundaries
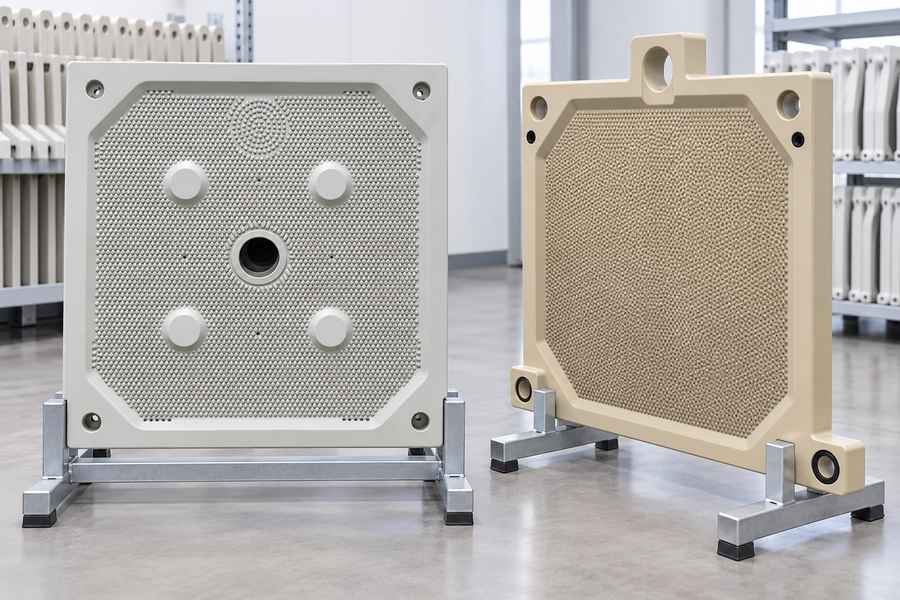
Compare press structures, plate arrangements, hydraulic closure systems, piping, controls, and downstream discharge arrangements. Include membrane squeezing utilities and any additional installation requirements.
Zonel Filtech offers chamber and membrane filter presses with configurable automation. Compare the same required duty and specify plate shifting and other automation consistently.
Where different machine sizes are necessary to meet throughput, compare properly sized installed systems rather than forcing identical plate counts or nominal chamber volumes.
Calculate the Investment Difference
Incremental installed cost = Membrane installed cost − Chamber installed cost.
Include equipment, freight, electrical connections, foundations, utility integration, commissioning, and training wherever applicable. State exclusions explicitly rather than assuming identical site work.
Use comparable supplier scopes and installation estimates. An equipment-only price difference cannot support a reliable payback calculation for a complete industrial installation.
A change in required utility capacity can affect installation scope even when press purchase prices appear similar. Assign that difference to the appropriate alternative.
Which Operating Savings Offset Added Costs?
Convert Cake Dryness into Disposal Tonnes
Wet cake tonnes = Captured dry solids tonnes / Cake dry solids fraction.
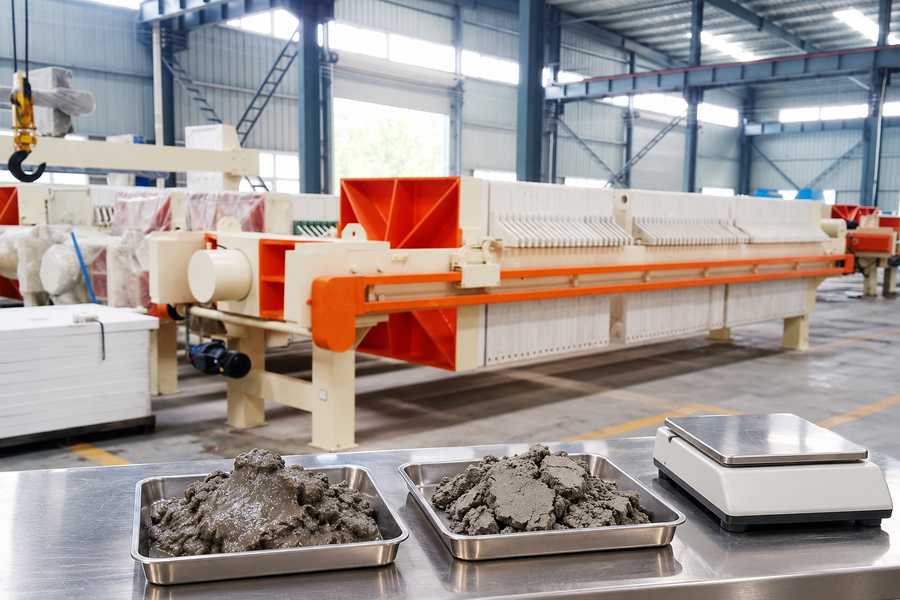
For the same captured solids, a higher dry solids fraction reduces wet cake mass. Savings depend on whether disposal and transport invoices actually follow that mass.
Annual disposal savings = Avoided wet cake tonnes × Disposal charge per wet tonne.
Check minimum haulage charges, container utilization, and landfill or treatment acceptance conditions. A drier cake may not reduce costs proportionally under fixed-fee contracts.
Account for the Entire Operating Difference
Compare incremental expenses and savings per dry tonne, then extend them to realistic annual volumes. Keep like-for-like costs on the same time and production boundary.
- Energy and utilities: Include feed pumping, membrane squeezing equipment, water or air supply where required, and any measurable changes in ancillary consumption.
- Consumables: Compare cloth consumption, cleaning chemicals, seals, and replacement intervals under the actual slurry and operating conditions.
- Maintenance: Include labor, scheduled servicing, and additional membrane-related components without charging membrane replacement a second time.
- Membrane replacement: Allocate an annual planning allowance, while separately documenting assumed lifespan, replacement cost, and the timing of actual expenditure.
For certain sealing applications, Zonel Filtech describes rubber edge-coated filter press cloth. Its suitability requires checking plate geometry, sealing requirements, and slurry compatibility; it is not universal.
Labor savings require equal scrutiny. Reduced handling time produces cash savings only when staffing, overtime, or contracted service expenses actually change.
Net annual savings = Verified annual operating benefits − Additional annual operating costs.
How Do You Calculate Simple Payback?
Set Out Transparent Hypothetical Assumptions
Consider a hypothetical industrial installation in the United States, using USD planning assumptions dated October 2026. These figures are not market prices, quotations, or measured equipment performance.
Assume each press captures 3,000 dry tonnes annually, meets the same filtrate specification, and has sufficient complete-cycle capacity for that duty.
| Hypothetical parameter | Assumed value |
| Captured dry solids | 3,000 t/year |
| Chamber cake dry solids | 25% |
| Membrane cake dry solids | 30% |
| Chamber wet cake | 12,000 t/year |
| Membrane wet cake | 10,000 t/year |
| Avoided wet cake | 2,000 t/year |
| Disposal charge | $75/wet tonne |
| Avoided annual disposal expense | $150,000 |
| Additional annual energy | $12,000 |
| Additional annual consumables | $3,000 |
| Additional annual maintenance | $5,000 |
| Annual membrane replacement allowance | $10,000 |
| Total additional annual operating costs | $30,000 |
| Net annual savings | $120,000 |
| Chamber installed cost | $1,000,000 |
| Membrane installed cost | $1,360,000 |
| Incremental installed investment | $360,000 |
| Simple payback | 3.0 years |
Work Through the Financial Arithmetic
At an assumed 25% cake solids, 3,000 / 0.25 = 12,000 wet tonnes annually. At 30%, 3,000 / 0.30 = 10,000 wet tonnes.
The hypothetical avoided quantity is 2,000 wet tonnes, giving 2,000 × $75 = $150,000 in annual disposal savings under the assumed weight-based tariff.
After $12,000 energy, $3,000 consumables, $5,000 maintenance, and $10,000 membrane replacement allowance, added operating costs total $30,000. Net savings equal $120,000 annually.
The assumed incremental investment is $1,360,000 − $1,000,000 = $360,000. Simple payback = $360,000 / $120,000 = 3.0 years.
These calculations exclude financing, taxes, depreciation, price escalation, and residual values. The illustrative installed costs assume otherwise comparable project boundaries, including necessary installation work.
An annualized replacement allowance simplifies cash outflows; actual membrane renewals occur at specific times. Model replacement payments in their expected years, then discount them over the planned service period.
The three-year figure is an arithmetic illustration, not an equipment guarantee. Replace every assumed input with trial results, installed proposals, and site operating records.
How Do Utilization and Throughput Change Payback?
Determine Whether Extra Capacity Has Value
Estimate annual practical capacity using measured complete-cycle dry solids throughput multiplied by available operating hours. Deduct scheduled downtime and interruptions outside the measured cycle; do not subtract routine cleaning already included in cycle time.
If both presses already meet annual demand, calculate economics at the same captured dry solids volume. Extra theoretical capacity earns no automatic financial credit.
Utilization reflects feed availability as well as machine uptime. A press capable of more cycles has limited financial advantage when the plant rarely supplies enough slurry.
A membrane press could improve throughput if squeezing enables faster overall cycles, but squeeze and discharge time may offset filtration gains. Only trials can establish the difference.
Avoid Counting Benefits Twice
When capacity constrains profitable production, evaluate incremental contribution margin after related operating costs. Confirm that feed supply and downstream equipment can use additional output.
Do not apply higher production volume to disposal savings while also assigning the same volume a separate avoided-disposal benefit. Reconcile all quantities within one annual model.
When greater throughput reduces operating hours for an unchanged duty, count only verified savings in electricity, labor, or supporting equipment operation, not speculative production revenue.
How Can You Test Payback Sensitivity Before Buying?
Change the Variables That Drive the Result
Recalculate conservative, expected, and favorable cases instead of presenting one payback figure as certain. Keep the same formula and documented scope in each case.
- Cake dryness: Test smaller differences in cake solids; reduced avoided wet tonnage directly weakens disposal savings.
- Disposal tariff: Vary actual weight-based charges and transport arrangements, especially where part of the invoice is fixed.
- Utilization: Test reduced annual captured solids, subject to minimum operating schedules and any demand constraints.
- Utilities and maintenance: Stress electricity, squeezing consumption, cloth life, repair needs, and membrane replacement intervals.
- Cycle time: Recheck full-cycle throughput under each trial condition, rather than assuming squeeze time is free.
If net savings reach zero or become negative, there is no positive simple payback under those assumptions, regardless of apparent improvements in cake dryness.
Report annual net savings alongside payback for every scenario. An attractive result based on optimistic dryness and unsupported maintenance estimates is not a reliable purchasing basis.
Specify Evidence for the Purchasing Decision
Request representative trial records, full-cycle timing, laboratory cake solids, filtrate quality, and measured utility consumption. Confirm compatibility and service intervals for selected plate and cloth arrangements.
Pair these findings with comparable installed quotations, disposal invoices, maintenance estimates, and credible utilization forecasts. Record assumptions so engineering and purchasing teams can reproduce the calculation.
Choose the press configuration that meets the required solids duty and filtrate standard with a defensible economic advantage, rather than relying on nominal dryness or capacity claims.